あなたと、フィットしたい…したくない?
【2020/3/29追記】Git-hub https://github.com/Buhin-Mara/Fittings
【イントロ】
Publish or Perish.
研究は、論文を書くまでが研究です。
つまり、実験(計算)してデータを取得するだけではなく、それが何を意味するか考えるまでが研究です。
データの意味を考える上で役に立つのがデータのプロット、フィッティングによる理論との比較です。
そこで、今回はPythonをつかった様々な物理量のプロットとフィッティングを行ってみました。
なお、温度や周波数依存性を観たかったので、パラメータは適当です。手を抜いてこそ・・・
【結果】
まずは練習として線形関数のフィッティングです。コレは簡単。
#線形関数のフィッティング

##フィッティングに使うもの
from scipy.optimize import curve_fit
import numpy as np

## 図示のために使うもの
import matplotlib.pyplot as plt

#x軸の配列
list_linear_x = range(0,20,2)

array_error = np.random.normal(size=len(list_linear_x))

array_x = np.array(list_linear_x)

#y軸の配列
array_y = array_x + array_error

#フィッティング
def linear_fit(x,a,b):
    return a*x+b

param, cov=curve_fit(linear_fit,array_x,array_y)

array_y_fit=param[0]*array_x + param[1]

#フィッティング結果のプロット
plt.plot(array_x, array_y,marker="o",label="Numerical calculation")
plt.plot(array_x, array_y_fit, marker="",label="Fitting")
plt.savefig('linear')
plt.legend()
plt.show()
 |
| 図1、線形関数のフィッティング |
練習をもう一つ、非線形関数のフィッティングです。コレで雰囲気がつかめてきました。
#非線形関数のフィッティング

##フィッティングに使うもの
from scipy.optimize import curve_fit
import numpy as np

## 図示のために使うもの
import matplotlib.pyplot as plt

#x軸の配列
list_linear_x = range(0,20,2)

array_x = np.array(list_linear_x)

#y軸の配列
list_y=[]
for num in array_x:
    list_y.append( 1.0*np.exp(num/(1.0+num))+np.random.rand()/10)

array_y=np.array(list_y)

#非線形関数のフィッティング
def nonlinear_fit(x,a,b):
    return b * np.exp(x / (a+x)  )

param, cov=curve_fit(nonlinear_fit,array_x,array_y)

list_y_fit=[]
for num in array_x:
    list_y_fit.append(param[1]*np.exp(num/(param[0]+num)))

array_y_fit=np.array(list_y_fit)

#フィッティング結果のプロット
plt.plot(array_x, array_y,marker="o",label="Numerical calculation")
plt.plot(array_x, array_y_fit, marker="",label="Fitting")
plt.legend()
plt.savefig('nonlinear')
plt.show()
 |
| 図2、非線形関数のフィッティング |
ここからは物理量のフィッティングです。
まずは、磁化率。 キュリー則として知られる、温度に反比例する振る舞いです。
##磁化率のキュリー則のフィッティング

##フィッティングに使うもの
from scipy.optimize import curve_fit
import numpy as np

## 図示のために使うもの
import matplotlib.pyplot as plt

#温度Tの配列
list_linear_x = range(1,100,1)

array_x = np.array(list_linear_x)

#磁化率キュリー則の温度依存性
list_y=[]
for num in array_x:
    list_y.append( 1.0 + 1/num + np.random.rand()/10)

array_y=np.array(list_y)

#キュリー則のフィッティング
def Curie_fit(x,a,b):
    return a + b/x

param, cov=curve_fit(Curie_fit,array_x,array_y)

list_y_fit=[]
for num in array_x:
    list_y_fit.append(param[0] + param[1] /num)

array_y_fit=np.array(list_y_fit)

#キュリー則のプロット
plt.plot(array_x, array_y, marker="o",label="Numerical calculation")
plt.plot(array_x, array_y_fit, marker="",label="fitting")
plt.title("Curie law")
plt.xlabel('temperature (K)')
plt.ylabel('magnetization(emu)')
plt.legend()
plt.savefig('Curie')
plt.show()
 |
| 図3、キュリー則のフィッティング |
次は、電気抵抗率。
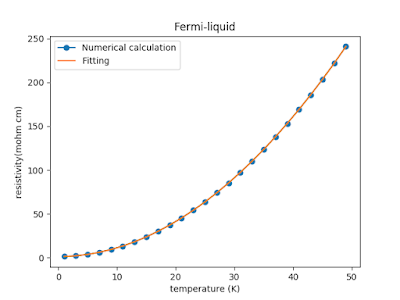
電子間相関に起因するフェルミ液体的な電気抵抗は温度の二乗に比例します。
非フェルミ液体では色々な温度依存性が生じるのも面白いですね。
#電子相関によるフェルミ液体の電気抵抗のフィッティング

##フィッティングに使うもの
from scipy.optimize import curve_fit
import numpy as np

## 図示のために使うもの
import matplotlib.pyplot as plt

#温度の配列
list_linear_x = range(1,50,2)

array_x = np.array(list_linear_x)

#電気抵抗の配列
list_y=[]
for num in array_x:
    list_y.append( 1.0 + 0.1*num*num + np.random.rand()/10)

array_y=np.array(list_y)

#フェルミ液体的電気抵抗のフィッティング
def Fermiliquid_fit(x,a,b):
    return a + b * x * x

param, cov=curve_fit(Fermiliquid_fit,array_x,array_y)

list_y_fit=[]
for num in array_x:
    list_y_fit.append(param[0] + param[1] * num * num)

array_y_fit=np.array(list_y_fit)

#フィッティング結果のプロット
plt.plot(array_x, array_y, marker="o",label="Numerical calculation")
plt.plot(array_x, array_y_fit, marker="",label="Fitting")
plt.title("Fermi-liquid")
plt.xlabel('temperature (K)')
plt.ylabel('resistivity(mohm cm)')
plt.legend()
plt.savefig('Fermi-liquid')
plt.show()
 |
| 図4、フェルミ液体的電気抵抗のフィッティング |
次は、同じく電気抵抗率ですが、フォノン散乱に起因する成分です。
こちらは、Bloch-Gruneisen関数とよばれる関数形を示します。
低温では温度の5乗に比例するため、上記の電子間相関が抵抗の主要因となります。 積分関数でフィッティングする際はScipyのOptimize.leastsq()をうまく使うのが大切のようです。
#フォノンによる電気抵抗の計算

##フィッティングに使うもの
from scipy.optimize import curve_fit
from scipy import optimize
from scipy import integrate
import numpy as np

## 図示のために使うもの
import matplotlib.pyplot as plt

#温度の配列
list_linear_x = range(1,300,1)

array_x = np.array(list_linear_x)

def Bloch(x):
    return (x**5)/((np.exp(x)-1)*(1-np.exp(-1*x)))

#Bloch-Gruneisen関数の配列
list_y=[]
for num in array_x:
    p=integrate.quad(Bloch,0,300/num)
    list_y.append(((num/300)**5)*p[0] +np.random.rand()/100)

array_y=np.array(list_y)

#ここから最小自乗によるフィッティング
def Bloch_fit(parameter,xs,ys):
    a=parameter[0]
    b=parameter[1]

    fxs=[(b*(x/a)**5)*integrate.quad(Bloch,0,a/x)[0] for x in xs]
    residual=ys-fxs
    return residual

#フィッティングの初期値
parameter0=[300,1]
result=optimize.leastsq(Bloch_fit,parameter0,args=(array_x,array_y))
print(result)
a_fit=result[0][0]
b_fit=result[0][1]

#フィッティングパラメータを使用した関数の配列
list_y_fit=[]
for num in array_x:
    p=integrate.quad(Bloch,0,a_fit/num)
    list_y_fit.append((b_fit*(num/a_fit)**5)*p[0] )

array_y_fit=np.array(list_y_fit)

#フィッティング結果のプロット
plt.plot(array_x, array_y, marker="o",label="Numerical calculation")
plt.plot(array_x, array_y_fit, marker="",label="Fitting")
plt.title("Bloch-Gruneisen")
plt.xlabel('Temperature(K)')
plt.ylabel('resistivity(mOhm cm)')
plt.legend()
plt.show()
 |
| 図5、フォノンによる電気抵抗のフィッティング |
Fermi-Dirac関数のフィッティングです。
あるエネルギーの状態は全て埋まっていて、 それ以上は空っぽのような占有状態を教えてくれます。
色々な実験に現れる関数ですが、電子の占有をみる光電子分光などでよく見かけますね。
#Fermi-Dirac関数のフィッティング

##フィッティングに使うもの
from scipy.optimize import curve_fit
import numpy as np

## 図示のために使うもの
import matplotlib.pyplot as plt

#エネルギーの配列
list_linear_x = range(1,100,1)

array_x = np.array(list_linear_x)

#FD関数の配列
list_y=[]
for num in array_x:
    list_y.append( 1/(np.exp(2*(num-50))+1) + np.random.rand()/60)

array_y=np.array(list_y)

#FD関数のフィッティング
def Fermi_Dirac_fit(x,a,b):
    return  1/(np.exp(a*(x-b))+1)

param, cov=curve_fit(Fermi_Dirac_fit,array_x,array_y)

list_y_fit=[]
for num in array_x:
    list_y_fit.append( 1/(np.exp(param[0]*(num-param[1]))+1))

array_y_fit=np.array(list_y_fit)

#フィッティング結果のプロット
plt.plot(array_x, array_y, marker="o",label="Numerical calculation")
plt.plot(array_x, array_y_fit, marker="",label="Fitting")
plt.title("Fermi-Dirac")
plt.xlabel('Energy (meV)')
plt.ylabel('f(E)(a. u. )')
plt.legend()
plt.savefig('Fermi-Dirac')
plt.show()
 |
| 図6、Fermi-Dirac関数のフィッティング |
光学伝導度を表すDrude-Lorentzモデルによるフィッティングです。
Drude項が自由電子による応答、Lorentz項がフォノンやバンド間遷移を表しています。 急峻なピークを示すLorentz項は初期値を適切に選んであげないと収束しづらいです。
実際には散乱率のせいでピークはブロードになっていることが多いです。
他にも、ディラック電子による応答や、散乱率に周波数依存性があると仮定する拡張Drudeモデルなどもあり、 色々な情報を引き出すことができます。
なんちゃってバルク敏感の某分光と違って、こちらは本物のバルク敏感なプローブです。
#光学伝導のフィッティング

##フィッティングに使うもの
from scipy.optimize import curve_fit
import numpy as np

## 図示のために使うもの
import matplotlib.pyplot as plt

#周波数の配列
list_linear_x = np.arange(1,200,0.2)

array_x = np.array(list_linear_x)

#Drude-Lorentz関数の配列
list_y=[]
for num in array_x:
    list_y.append( 1.0 + 1/(1+num**2) \
    + num**2/(5*num**2+((100*100-num**2)**2))\
    + np.random.rand()/60)

array_y=np.array(list_y)


#Drude-Lorentz関数のフィッティング
def Drude_Lorentz_fit(x,a,b):
    return a + 1/(1+x**2) + x**2/(5*x**2+(b**2-x**2)**2)

#初期値の設定,ローレンツピークの位置を指定しないと上手くいかない
a_initial=1
b_initial=100
param, cov=curve_fit(Drude_Lorentz_fit,array_x,array_y,[a_initial,b_initial])

list_y_fit=[]
for num in array_x:
    list_y_fit.append( param[0] + 1/(1.0+num**2) \
    + num**2/(5*num**2+(param[1]**2-num**2)**2))

array_y_fit=np.array(list_y_fit)

#光学伝導度のプロット
plt.plot(array_x, array_y, marker="o",label="Numerical calculation")
plt.plot(array_x, array_y_fit, marker="", label="Fitting")
plt.title("Drude-Lorentz")
plt.xlabel('frequency (cm^-1)')
plt.ylabel('conductivity(Ohm^-1 cm^-1)')
plt.legend()
plt.savefig('Drude')
plt.show()
 |
| 図7、Drude-Lorentzモデルのフィッティング |
最後は超伝導転移に伴う比熱のフィッティングです。
比熱からは超伝導ギャップの大きさや、ギャップのノード(節、ある特定のk方向でギャップがゼロになる部分)の有無、 常伝導状態の電子比熱成分からは電子間相関の強さ(いわゆる重い電子系)を推定できたりと得られる情報がたくさんあります。
ただし、実用的にはフォノン成分の取り除き方が難しいのが難点と思います。 (Tcの低い物質では磁場で超伝導を潰してフォノン成分を見積もり、それを引けば良いです。Tcが高い物質だと、 臨界磁場も大きく完全な常伝導状態のフォノン成分を推定するのが難しいため、フィッティングの任意性が大きくなってしまいます。)
その場合、ゼロ温度成分の磁場依存性からギャップ構造を推定することもあります。
いわゆるVolovik効果などですね。
##比熱の温度依存性の計算

##フィッティングに使うもの
from scipy.optimize import curve_fit
from scipy import optimize
from scipy import integrate
import numpy as np

## 図示のために使うもの
import matplotlib.pyplot as plt

#Temperature
list_linear_T = range(1,100,1)
array_T = np.array(list_linear_T)

#gap^2の温度依存性の数値計算
list_gap=[]
for num in array_T:
    def f(d):
        def gap(x):
           return np.tanh(1/num*np.sqrt(x**2+d**2))/np.sqrt(x**2+d**2)


        fxs=integrate.quad(gap,0,500)
        residual=3-fxs[0]
        return residual

    p=optimize.fsolve(f,0)
    list_gap.append(p[0]**2)

gap2=np.array(list_gap)

dg2=np.gradient(gap2)

#比熱の温度依存性の計算
list_C=[]
for num in array_T:
    def f(E):
        return (np.exp(np.sqrt(E**2+gap2[num-1])/num))/(np.exp(np.sqrt(E**2+gap2[num-1])/num)+1)**2\
        *(E**2+gap2[num-1]-num/2*dg2[num-1])

    p=integrate.quad(f,0,1000)
    list_C.append(2/num/num/num*p[0])

C_gap=np.array(list_C)

#比熱の温度依存性のプロット
plt.plot(array_T, C_gap, marker="", label="Numerical calculation")
plt.title("Electronic specific heat")
plt.xlabel('Temperature(K)')
plt.ylabel('C_el(J/K)')
plt.legend()
plt.savefig('C_el(T)')
plt.show()
 |
| 図8、超伝導ギャップの温度依存性 |
 |
| 図9、比熱の電子成分の温度依存性 |
【まとめ】
いろいろな物理量をプロット、フィッティングしました。
Pythonのモジュールをうまく組み合わせれば、大体の関数をフィッティングできるようです。ただし、でてきたパラメータが正しい値かは慎重な考察が必要です。
正しいかどうかの判断ができるのは、今の所人間だけですから…
データを上手に解析して、あなただけの自然の真理に迫りましょう!
【参考文献】
参考にしたWeb記事
・Pythonで非線形関数モデリング
・測定データを積分関数でフィッティングしたいです。
・Scilabで関数フィッティング: 金属の電気抵抗
・importコマンドの使用例(1) 超伝導ギャップと比熱
・Introduction to Superconductivity Chapter 3 The BCS Theory
参考にした論文
・光学伝導度:D.N.Basov et al., "Electrodynamics of correlated electron materials", Rev. Mod. Phys., 83, 471(2011)
・比熱:G. Mu et al., "Low temperature specific heat of the hole-doped Ba0.6K0.4Fe2As2 single crystals", PRB 79, 174501 (2009).


コメント
コメントを投稿